
 Login
Login
Having a lot of data is one thing, but making sense of it is another. If the data isn’t presented properly, even experts can struggle to understand it. For someone with no background in data, it’s even worse—they might misinterpret the information completely.
This is where data visualization comes in. It’s all about converting raw numbers into clear, easy-to-read charts, graphs, and visuals. A well-designed chart can reveal patterns, trends, and insights instantly, making complex data simple to understand. But if done poorly, it can create confusion instead of clarity.
Good visualization isn’t about making data look nice, it’s about making it useful.
In this blog, we will understand the top 5 commonly made mistakes in data visualization.
Basic Principles of Data Visualization
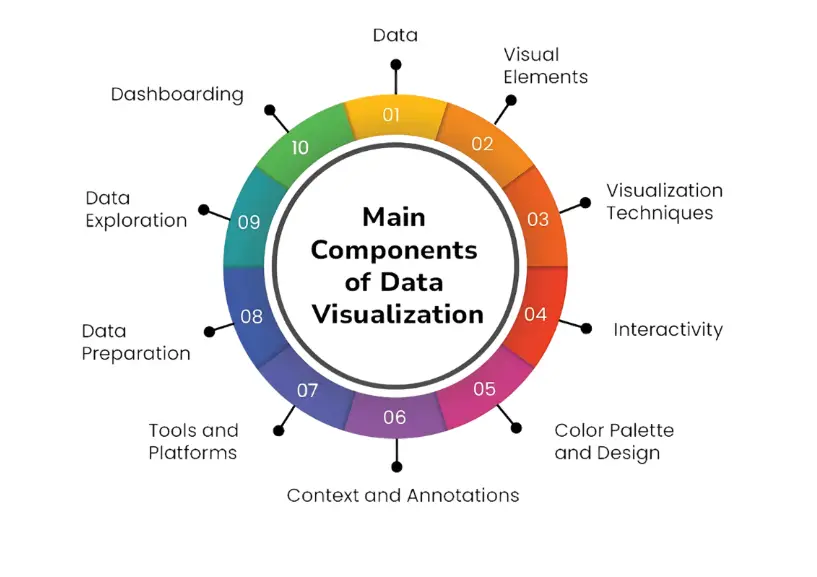
Before diving into the mistakes, let’s understand the basics of data visualization. It’s all about presenting data in a visual format—like charts, graphs, or infographics—so that people can interpret the data easily.
- Clarity: The visualization should be easy to understand. Avoid clutter.
- Accuracy: The data must be presented truthfully without any manipulation.
- Consistency: Use consistent colors, fonts, and layouts across all your visuals.
- Focus: Only highlight the important parts of your data. Don’t overwhelm the viewer.
To clarify, let’s examine the top five common mistakes made by experts and how these mistakes can help us better understand things.
- Choosing the Wrong Type of Chart:
Every chart has a story to explain. There are various charts available, like line charts, pie charts, bar charts, etc., as per your research, and which chart type is more applicable that makes the patterns, trends, and insights more meaningful, you have to select that chart. If you pick the wrong one, people will not understand the message behind the data.
Comparison of Different Charts and Their Uses
| Chart type | Best use for | Avoid when |
| Line | Showing trends over time | Comparing multiple categories in detail |
| Bar | Comparing different type | Showing changes over time. |
| Pie | Showing part of the whole | More than 4-5 categories. |
| Scatter | Showing the relationship between two variables | When data points overlap too much |
| Histogram | Showing frequency distribution | Comparing categories |
Tip: Before choosing a chart, ask yourself, “What is the key message I want to deliver?” and pick the best chart type.
- Too Much Information in One Chart:
If you add too much data to one chart, then it becomes messy and hard to understand. It becomes difficult even for you and any non-technical person to make any conclusion out of charts, graphs, and images. It is preferred to have only limited numbers of data that are important and even by using those data the chart does not become complex.
Example:
- A pie chart with 10 slices is hard to read.
- A bar chart with 20 bars will look crowded
Overloaded vs. Simplified Chart
| Overloaded Chart | Simplified Chart |
| 10+ categories in a pie chart | Only 4-5 categories for clarity |
| Multiple overlapping trend lines | Separate charts for better focus |
| Too many labels and legends | Only the necessary details |
Tip: Less is better than too much data that overloads the charts. Keep it simple so that anyone can easily understand it.
- Using Incorrect Scale or Axis
Scale (X-axis and Y-axis), you think that even if the axes are mentioned wrongly it makes no difference. But in reality, it has much more difference. These small mistakes lead to misinterpretation of the data. Confusion is established and it makes the data more complex and difficult to understand even by experts and the common person.
Common Scale Mistakes & How to Fix Them
| Mistakes | Why it’s wrong | How to fix it |
| The Y-axis doesn’t start at 0 | Makes small differences look bigger than they are | Always start from 0 unless necessary |
| Uneven intervals in the axis | Creates misleading patterns | Use equal intervals for accuracy |
| No labels on the axis | Viewers don’t understand values | Clearly label the X and Y axis |
Tip: Always double-check after scaling both axes to ensure that data are correctly labeled or not.
- Poor Labeling and Missing Information
This is the one of the most common mistakes made by the expert is that they don’t label the information in the chart. If the chart has not been given a proper title and all the elements that are used are not labeled properly it becomes difficult for anyone to understand the data.
Key Elements Every Chart Must Have
| Elements | Why it’s important |
| Title | It helps people understand what the chart is about |
| Axis Labels | Labels will clearly define what data is being measured |
| Legend | Explain the different colors or symbols used |
| Data Source | Builds credibility and trust |
Tip: A well-labeled chart is essential for the understanding of the data, unlike the uncleared and non-labeled charts.
- Making the Design Too Complex
A chart needs to be simple and easy for anyone to understand. Adding too much color, 3-D effects, etc will make the chart look messy. Avoid unnecessary decorations. The focus should be on keeping the chart simple and using labels and colors whenever necessary.
Bad vs. Good Design Practices
| Bad Practices | Good Practices |
| Too many bright colors | Use 3-4 colors max |
| 3D bar charts (hard to read) | Use 2D charts for clarity |
| Fancy fonts | Simple, readable fonts like Arial or Roboto |
| Unnecessary effects (shadows, gradients) | Keep it clean and simple |
Tip: Make sure the chart is easy to read and understand.
Things to Keep in Mind While Creating a Data Visualization
Challenges in Data Visualization
- Poor data quality: If your data is incomplete, or incorrect then it becomes data to make any interpretation out of the data. You have to make sure that whatever you are collecting is from reliable sources because complete insights are taken from the available data. If the data is wrong then the complete strategy is wrong. Before creating visualizations, always make sure that your data is clean. This means checking for all the errors and mistakes.
- Understanding the audience: Every audience has a different understanding. Like if you are showing all the charts and graphs to the data scientist they can interpret what the data is telling. But the same data and visuals are showing to the common person they may not get in one go. So it is essential to know your audience how much they know the field, and how you will present your insights.
- Choosing the Right Tools: It is essential to understand how all the tools in data visualization work because every tool has advantages and disadvantages. You have to choose the tool that fits your research. In simple data visualization, excel might be sufficient. In complex data visualization, Tableau, Power BI, and Google Data Studio etc tools are used.
Conclusion:
Data visualization is a very powerful way of communicating complex data into charts, graphs, and visuals that help the person to get more clarity on what data is trying to explain. By avoiding these five common mistakes—choosing the wrong chart, overloading data, incorrect scale, missing labels, and complex designs—you can create visualizations that help people understand and make better decisions.
By following the tips in this blog, you’ll be on your way to creating effective data visualizations that not only communicate insights but also drive meaningful action.