 Login
Login
Learn data analytics from scratch! Understand what data analytics is, why it’s important, real-life use cases, tools to learn, and how to start your journey in 6 steps.
Today, data is the raw oil powering the modern world. However, like oil needs refining to be valuable, data needs analysis to become insight. That’s exactly where Data Analytics comes in!
From social media platforms to e-commerce to businesses all around the world, data analytics is quietly working behind the scenes everywhere. So, whether you’re a student, job seeker, or business owner, understanding data analytics is a must.
In this beginner’s guide, you’ll learn:
1. What is data analytics?
2. Why it’s important
3. Real-life examples of how it works
4. And the 4 basic steps you need to know to get started
What is Data Analytics?
Data Analytics is a process through which raw data is examined to draw meaningful conclusions.
In simple words: Data Analytics = Data + Logic + Insights + Action
Understanding the Concept of Data Analytics for Beginners
Data Analytics is the science of examining raw data to conclude conclusions. Its process involves a systematic approach starting from collecting data, followed by organizing them and then finally analysing them to draw conclusions regarding trends, patterns and valuable insights.
Each of these steps helps in turning unstructured data into actionable decisions.
Today, data analytics is being used across industries— from small startups to big companies- in order to increase their profit as well as performance.
Difference between Data and Analyzed Data
| Term | Meaning | Example |
| Data | Raw facts or numbers | Sales Data (200, 300, 500) |
| Information | Structured data that conveys meaning | Sales increased from 200 to 300 |
| Analysed Data (Analytics) | Insights/conclusions drawn from information | Sales increased by 150% because of the Campaign run! |
Types of Data Analytics
There are four different types of data analytics, namely–
1. Descriptive Analytics
This type of data analytics summarizes or describes past data to understand what has happened. For example, it is used to analyse monthly sales reports or website traffic reports, and it concludes like– Have the sales in this month gone up? Has the number of views risen?
2. Diagnostic Analytics
This is a more focused analysis, concentrated on finding out the causes behind why something happened. It involves more varied inputs along with hypothesizing, like analysing customer feedback or campaign performance, and finding out results like sales dropped because customer engagement fell.
3. Predictive Analytics
This type of data analytics focuses on forecasting future trends based on historical/past data. Predicting customer churn or sales for the next quarter– this is what comes under this. It gives out results like–
If trends continue, sales may rise 15% next month.
4. Prescriptive Analytics
This type of data analytics is action-oriented. It recommends actions based on data insights. For example, it will suggest personalized marketing campaigns based on data insights.
Data analytics helps businesses make better decisions by using facts and numbers instead of just guessing. In finance, it’s used in programs like Six Sigma to find and fix problems. Think about it this way—you can’t improve your health without tracking your weight, right? The same goes for businesses. They need to measure things to make them better.
Industries like travel and hospitality also use data analytics a lot. Since things move quickly there, they collect customer data to see what’s working and what’s not. This helps them fix issues faster and gives customers a better experience.
Why is data analytics important?
Here are the top five reasons why data analytics is important.
1.Data is Everywhere and It’s Growing Fast
We live in the age of data explosion. According to a report by Statista, over 120 zettabytes of data were created globally in 2023 alone, and this number is expected to grow to 181 zettabytes by 2025.
But what’s the use of this huge amount of data if we don’t analyze it? That’s where data analytics becomes crucial.
2. Turning Raw Data into Smart Decisions
Data analytics helps organizations run their businesses. How?
- By helping to understand customer behavior
- By assisting in improving products and services
- By predicting future trends
- By making faster and smarter decisions
3. Used Across Every Industry
From small businesses to global giants, every industry is using data analytics, such as:
- E-commerce: to recommend products and increase sales
- Healthcare: to detect diseases early and personalize treatment
- Finance: to detect fraud and manage risk
- Travel & Hospitality: to improve customer experience
- Education: to track student performance and personalize learning
Even government departments use data analytics for public policies and digital governance.
In short, there is no field left that runs without data analytics because if they choose to do so, then their productivity and growth willn’t be enough!
It would be like walking forward blindly.
4. High Demand = High Opportunity
According to the U.S. Bureau of Labor Statistics, the demand for data analysts is expected to grow by 23% between 2021 and 2031, which is much faster than the average for other professions.
Particularly, in India, over 11 million data science jobs are expected to be created by 2026 (NASSCOM).
The global data analytics market is expected to reach $655 billion by 2029 (Fortune Business Insights).
That means—more jobs, better salaries, and long-term career growth!
5. Why Does It Matter to You?
Even if you’re not from a tech background, learning data analytics will be beneficial for you. So, if you want to switch careers, get a promotion, start your own business, or simply understand how the digital world works, learning data analytics will be highly beneficial.
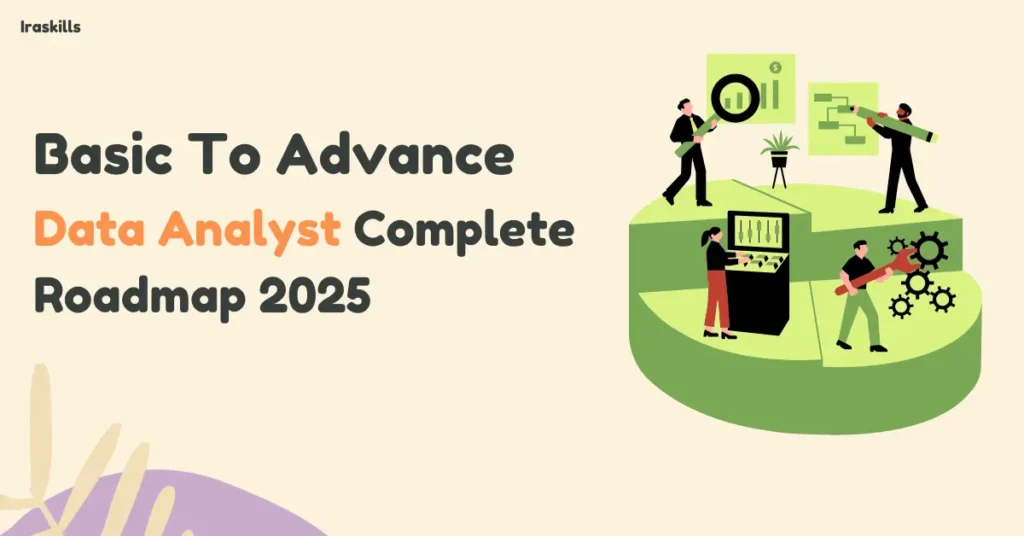
How to Get Started with Data Analytics: 6 Easy Steps for Beginners
To get started in data analytics, you don’t need to be a coding expert or a mathematical genius. You just need the right steps and a learning mindset.
Here’s a simple, 6-step roadmap to help you get started:
1. Understand the Basics
Start by understanding what data analytics is, its types (descriptive, diagnostic, predictive, prescriptive), and how it’s used across industries. Read blogs, watch YouTube videos, or enroll in beginner-friendly courses.
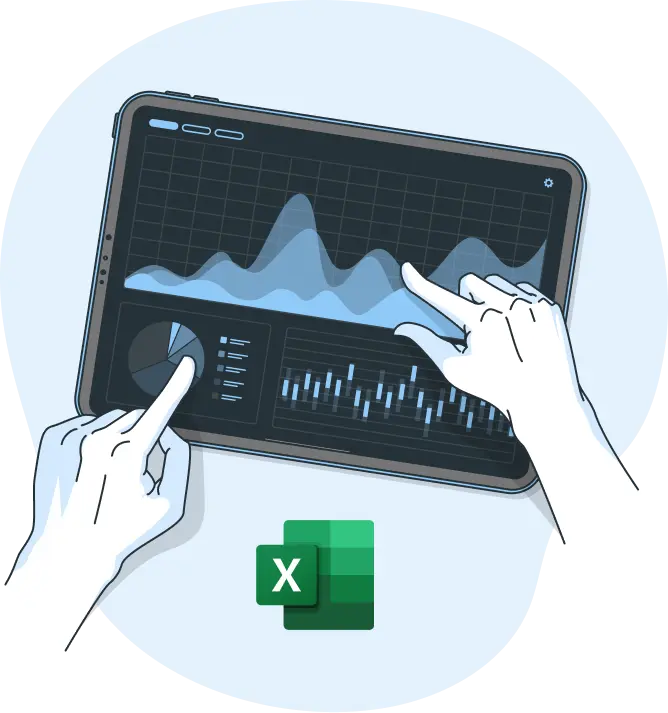
2. Learn Excel First
Before jumping into advanced tools, learn how to analyze data with Microsoft Excel. It’s easy, powerful, and used by nearly every organization.
You can learn this from IRA Skills!
3. Get Familiar with Statistics
After the first two steps, learn basic statistics like mean, median, standard deviation, correlation, and probability to make sense of the data.
4. Start Exploring Data
Download free datasets from sites like Kaggle or Data.gov and try to find trends or patterns. Play around and observe—this is how real learning begins.
5. Learn Tools & Techniques
Once you’re comfortable with basics, start learning tools like Power BI, SQL, Python, and more (we’ll break it down in the next section). These help you clean, visualize, and analyze data better.
6. Work on Projects & Build a Portfolio
Apply what you’ve learned through mini-projects. Create dashboards, visual reports, or even case studies. Showcase them on LinkedIn or GitHub to attract job opportunities.
Tools to learn for Beginners in Data Analytics
1. Excel- This is a must! It helps in organizing and analyzing data with formulas, charts, and pivot tables.
Every analyst starts here. It is easy to learn.
2. SQL (Structured Query Language)
This allows you to interact with databases—retrieve, insert, update, or delete data.
Almost every company stores data in databases, and SQL helps you fetch that data like a pro.
3. Power BI / Tableau
These are data visualization tools that turn boring data into beautiful dashboards.
Visual storytelling is a key skill in analytics. These tools help communicate insights.
4. Python
This is a programming language with libraries (like Pandas, NumPy, and Matplotlib) designed for data analysis.
It is a great tool for automation, big data processing, and advanced analysis. It’s also beginner-friendly!
5. Google Sheets & Google Data Studio
This is a cloud-based tool for collaborative data work and live dashboards.
Data Analytics Jobs at entry and advanced levels
In Data Analytics for entry-level, these job roles are available:
- Junior Data Analyst
- Junior Data Scientist
- Associate Data Analyst
In Data Analytics for the Experienced level, the mentioned job roles are available:
- Data Analyst
- Data Architect
- Data Engineer
- Data Scientist
- Marketing Analyst
- Business Analyst
Learn All This from Scratch with IRA Skills!
IRA Skills provides courses on each of these tools. You can learn them well from here.
Our programs cover:
- Excel, SQL, Power BI, and Python
- Real-time projects
- 1:1 mentorship
- Certification
- Career guidance and job support
You can get started with Excel with IRA Skills’ Sunday workshop–
Start your journey today with IRA Skills
Conclusion
Data is the future. And data analysts are in high demand across industries—marketing, finance, healthcare, education, logistics, and more. Whether you’re a student, job-seeker, or business owner, learning data analytics gives you a future-proof edge.
The best part? You don’t need to be perfect to start. You just need to start.
So take that first step today because the world needs more data-driven thinkers like you!